The Plot
Click for PDF version
Abstract
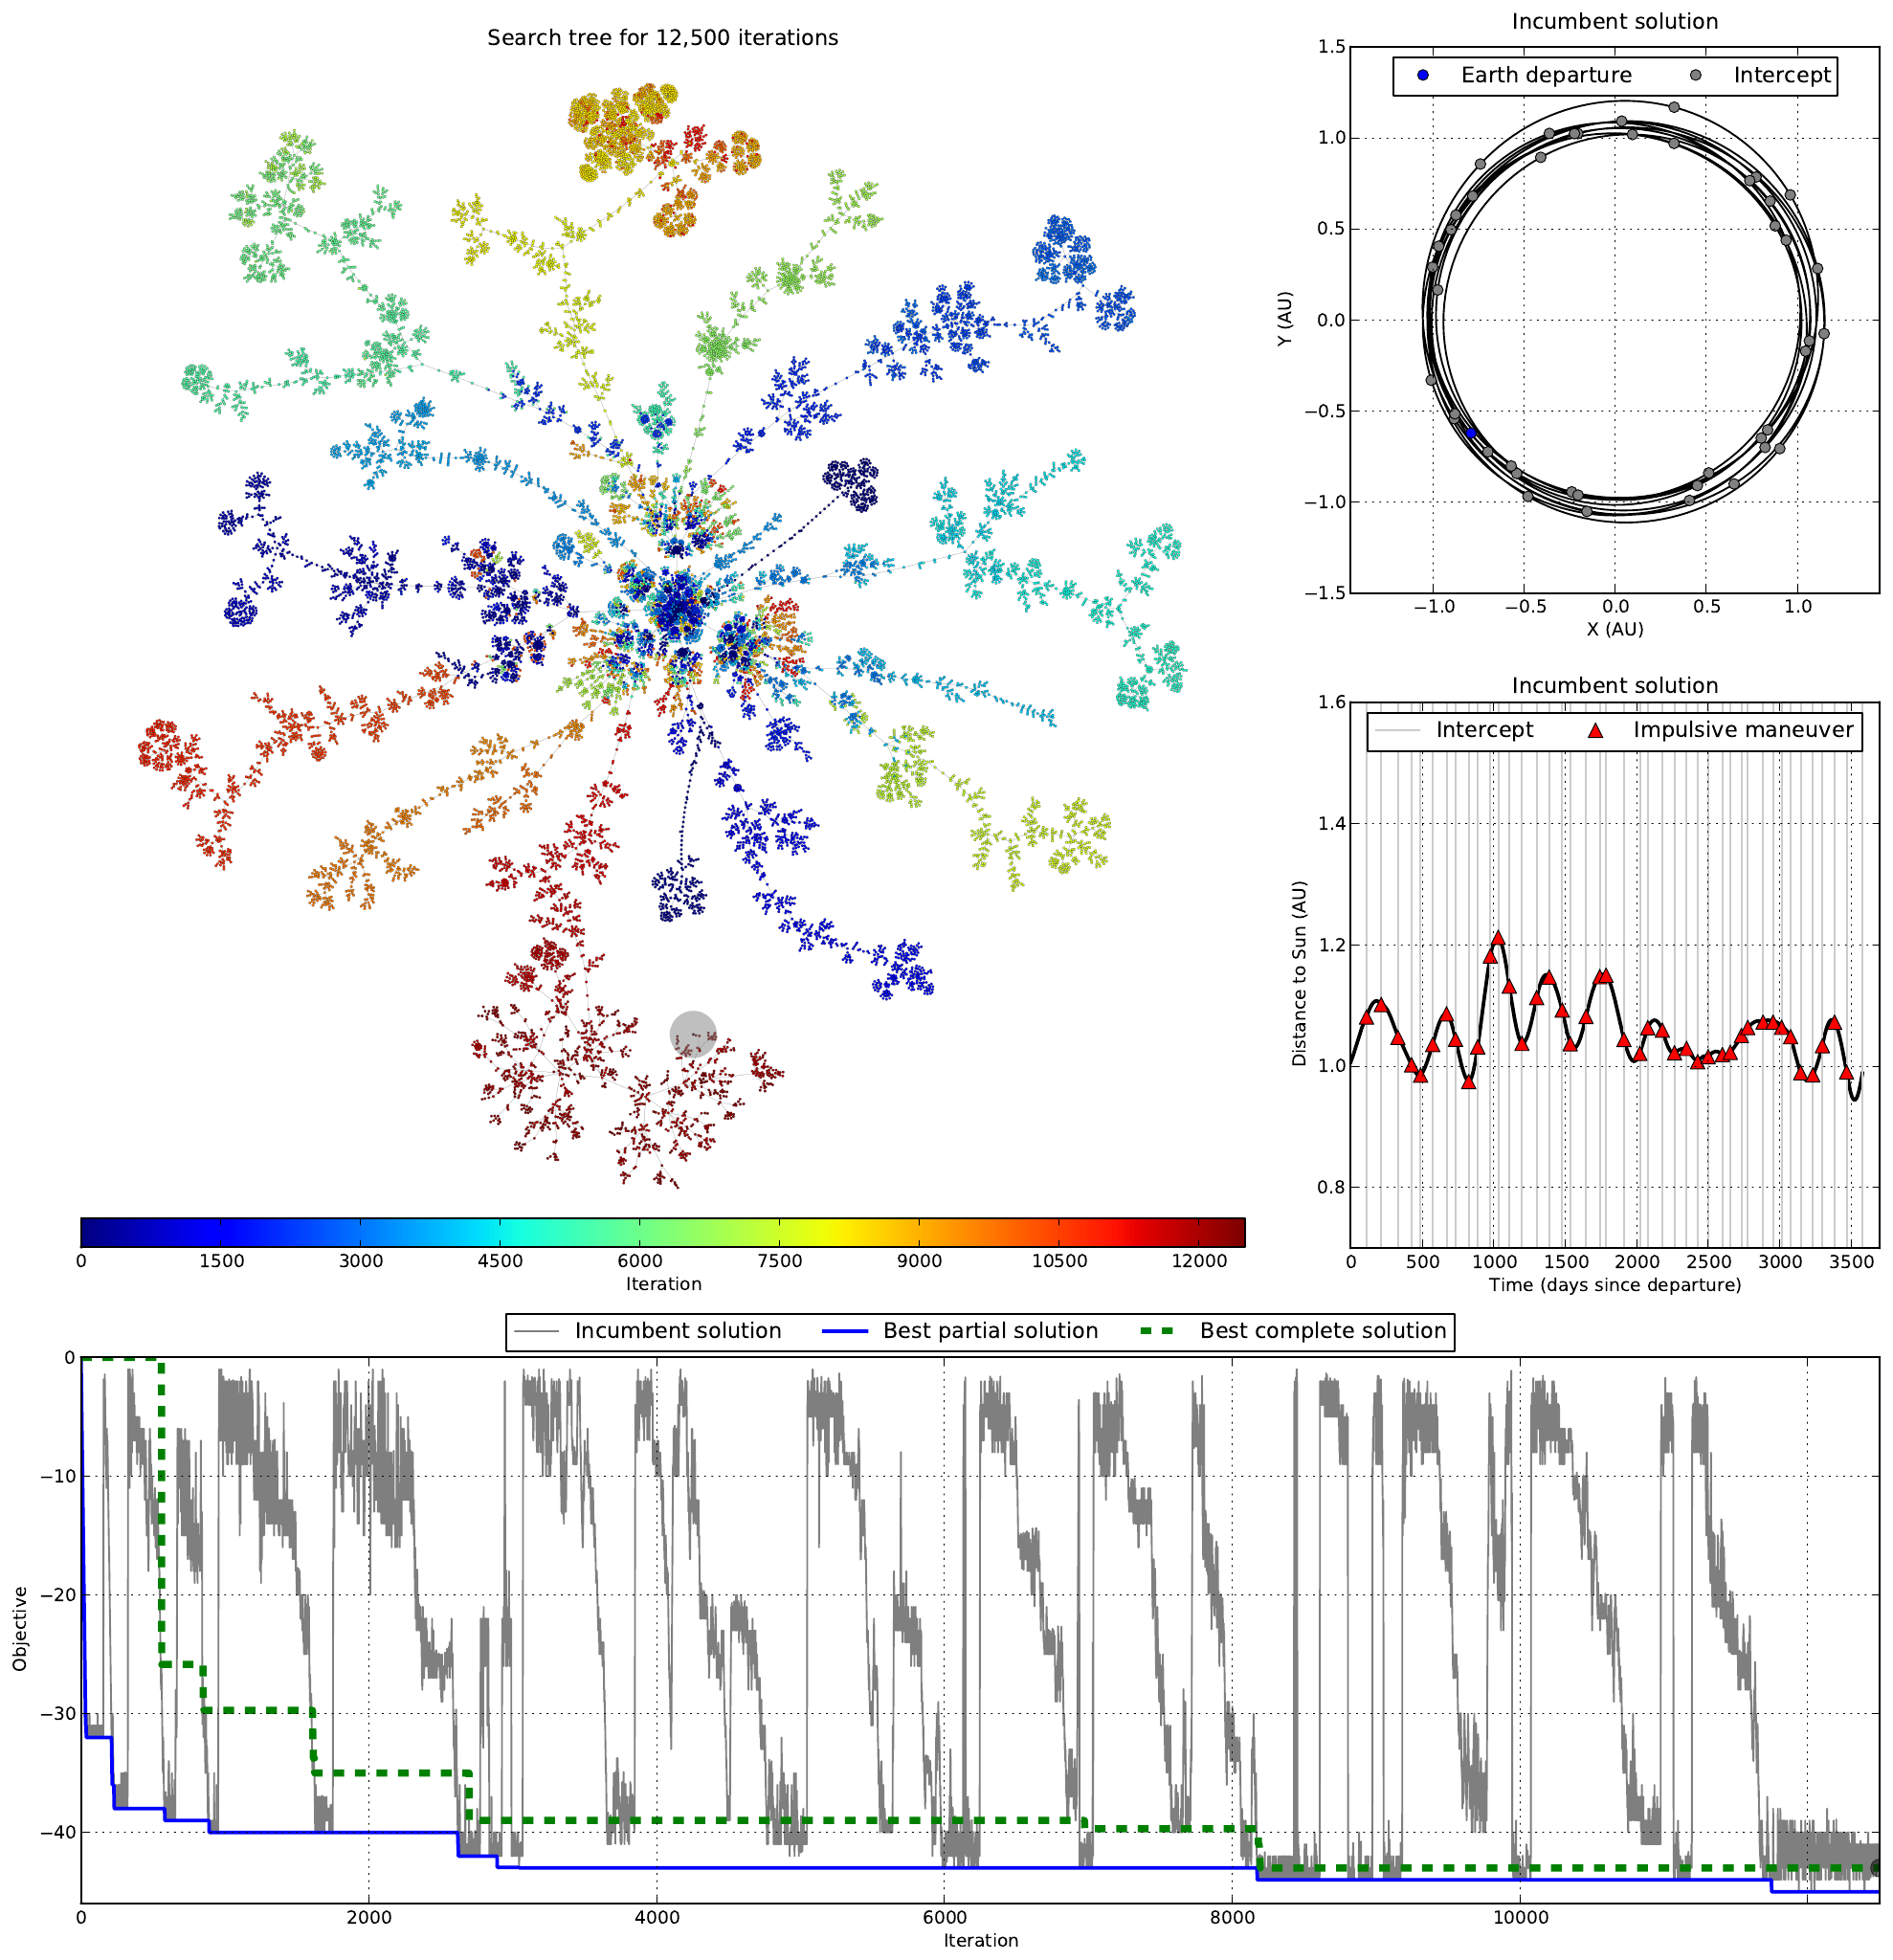
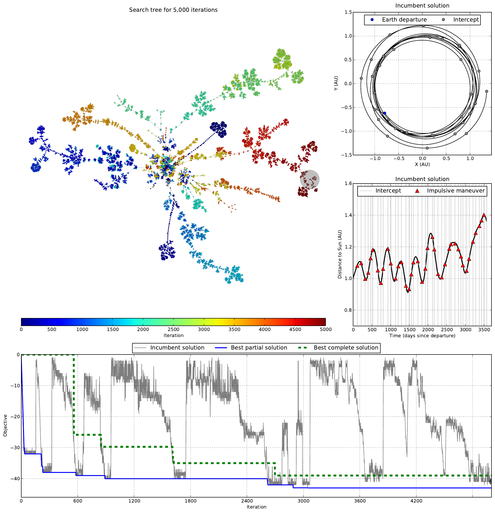
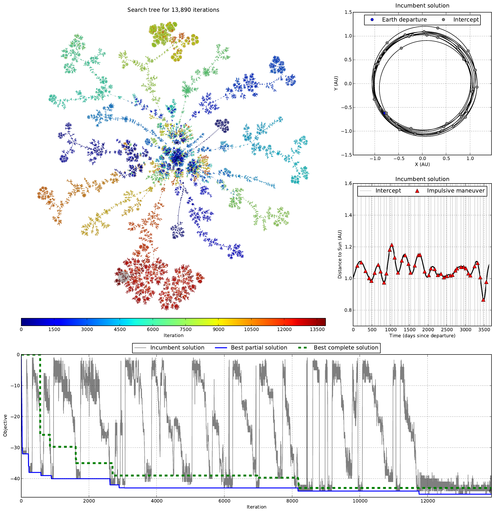
The figure illustrates the search for optimal spacecraft tour trajectories and is used in part of my dissertation research. The problem shown is from the fourth annual Global Trajectory Optimization Competition (GTOC4). The objective is to find trajectories visiting a maximum number of near-Earth asteroids subject to spacecraft and timing constraints. A tabu search algorithm is combined with a tree-based solution representation to solve the problem.
At the beginning of the search, the tree consists of only a root node corresponding to initial conditions of the spacecraft at Earth. At each iteration, new solutions are constructed by adding nodes to the tree, where each node represents a trajectory segment to a target asteroid. A full trajectory is composed of a series of trajectory segments that can be found as a path through the tree starting at the root node. The search tree thus maintains a population of feasible solutions and allows new solutions to be efficiently explored. The exploration is guided by the tabu search algorithm which implements strategic intensification, diversification and dynamic neighborhood selection approaches.
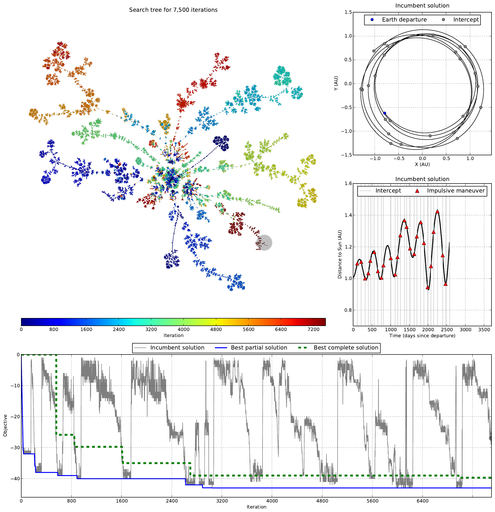
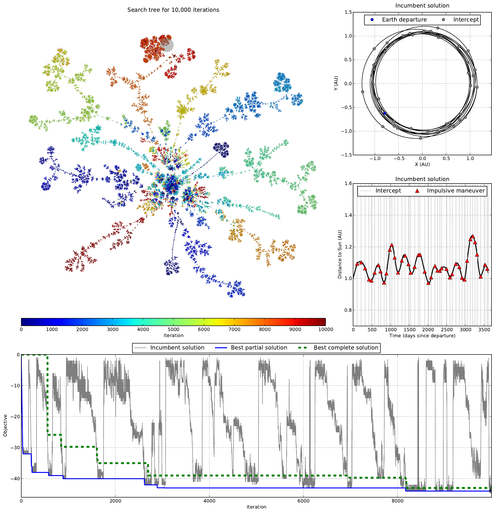
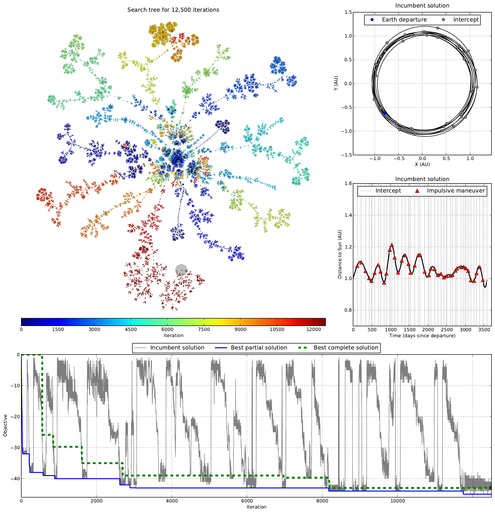
The search tree is visualized according to a force directed graph layout. The node coloring indicates the iteration at which a node is added to the tree, with cool colors corresponding to early iterations and warm colors corresponding to the latest. The incumbent solution of the latest iteration is highlighted with a gray halo. The behavior of the search is then apparent – the viewer can distinguish when the search is intensifying in one region of the search space (e.g. depth-first search) or maintaining a diverse exploration over varying solutions, for example. This visualization has aided in the design of dynamic neighborhood selection strategies to improve the overall search performance.
An additional plot shows the objective history. The incumbent solution objective is shown for each iteration, as well as the best found solutions. A partial solution satisfies intermediate constraints of the problem, while a complete solution also satisfies final constraints and solves the original problem statement. The viewer can correlate the performance with the search behavior shown in the search tree. Finally, the incumbent solution is shown for the current iteration in two plots showing its actual trajectory and properties.
This approach has found new solutions to the GTOC4 problem among the best known. The runs here were computed on the Stampede supercomputer at the Texas Advanced Computing Center. This solution methodology is applicable to related problems such as orbital debris cleanup and satellite servicing mission design that are the subject of future research.
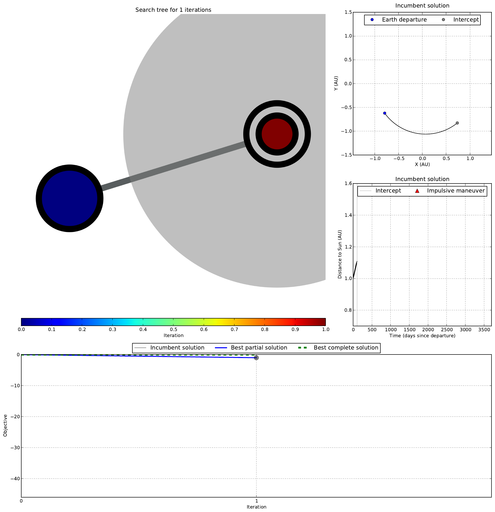
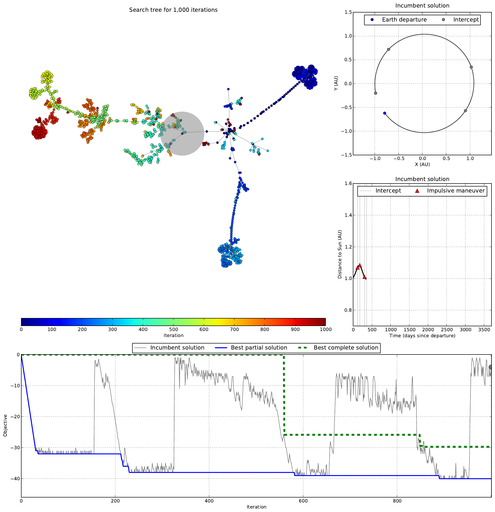
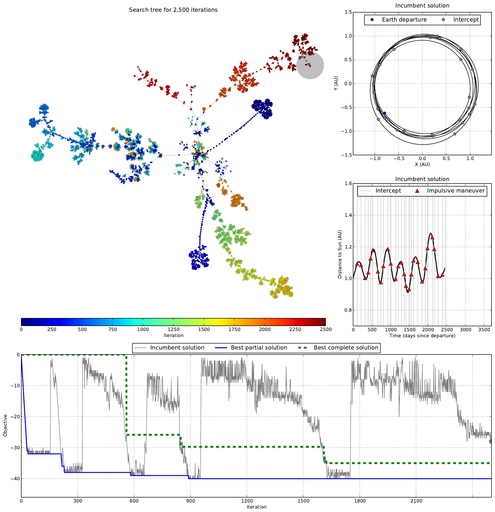
These plots are generated for each iteration of the search and animated to better visualize the process. This animation is provided below.
Code
- graph.py
Generates the graph view of the search tree and renders to PDF or PNG. Requires graph-tool.
- combined_plot.py
Generates the matplotlib-based plots and the combined plot including the graph view of the search tree.
Data
- data.zip
Archive containing graph DOT file, example layout, iteration history and incumbent solutions for several iterations.
Usage
Plots can be generated for the provided iterations: 1, 1000, 2500, 5000, 7500, 10000, 12500 and 13890. Replace the #'s below with one of these iteration numbers.- Download the code and data. Extract the data archive in the same directory as the Python scripts.
- Generate a graph view for one of the provided iterations.
python graph.py --load data/graph-layout.pickle --ignoreleafs --iterations # - Generate the combined plot PDF for the same iteration above.
python combined_plot.py --pdf #
Plots for other iterations
Click for PDF versions.
Animation
The animation below shows the search from start to finish. Each frame is generated from the above scripts. It should play in Chrome and Firefox (but not Safari!).
Contact
Greg Johnson, 